Ever since the publication of Richard Lynn and Tatu Vanhanen’s
IQ and the Wealth of Nations
more than four years ago, I’ve been
beating the drums
about how hugely important is their finding of a high correlation (r =
0.73) between average national per capita GDP and average national IQ.
Yet this fascinating research has been almost completely spiked in
the press. For example, you might think that
The Economist would owe its
$129-per-year subscribers some coverage of this research that has so many implications for international business and investing.
Yet the only time
The Economist has mentioned the book was in citing it as the source when the magazine fell for that
bogus blue-states-have-higher-IQ-hoax!
Now, Lynn has a new book out,
Race Differences in Intelligence
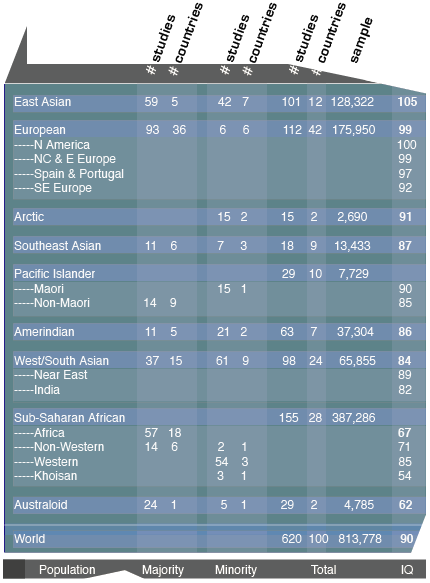
which tabulates 620 separate studies of
average IQ from 100 different countries with a total sample size of
813,778. That’s nearly four times the number of studies summarized in his book with Vanhanen. (Here is
J.P. Rushton’s review on VDARE.com, and here is
Jason Malloy’s review on GNXP.com.)
This profusion of data allows us to do analyses of important issues that haven’t been feasible before.
How do
high IQ people
rationalize to themselves suppressing mention of national differences
in average IQ—especially when they spend so much time thinking about how
they, personally, are smarter than other people?
A common stratagem, I’ve found, is to assume that IQ differences matter only if they are genetic in origin. Since no decent, civilized, right-thinking person could possibly believe that racial differences in IQ have any genetic basis, then racial and national differences in average IQ can’t possibly exist.
Except—they do exist.
And, as I will show that—no matter what their origin, whether in
nature or nurture or both—these IQ gaps will continue to exist for many
decades.
So
we need to think about differences in thinking.
Here’s an above-average quality
example of the usual kind of wishful thinking from James C. Bennett, author of
The Anglosphere Challenge: Why the English-Speaking Nations Will Lead the Way in the Twenty-First Century, on his interesting
Albion’s Seedlings blog.
Bennett had started a discussion of the important topic of the
differences between China and India (which I discussed in VDARE.com in
“Interesting India, Competitive China”). Both economies have been growing fast, going back to China freeing up its economy in 1978 and India in 1991.
Bennett’s view is that India is a better bet in the 21st Century
because it will benefit from institutional advantages over China. As a
former British colony, it is part of the Anglosphere, and thus enjoys
common law, representative government, and other
benefits of
the Anglo tradition.
I’m sympathetic to this view. (Although, to be realistic, when it comes to honesty and efficiency,
today’s Indian state isn’t exactly Her Majesty’s Government under
Gladstone).
Still, there’s the brute fact that,
despite its regime’s many shortcomings, China has been growing faster than India—and for much longer.
The simplest explanation: the
Chinese people make up for the failures of the Beijing oligarchy.
In the discussion, I noted that my Indian friends frequently tell me that they are far from
representative of their country. They say Westerners should not generalize from the software industries of
Bangalore to all of India. Due to the
endogamous caste system, India is very diverse—much more so than China.
The big question is: what are the national average IQs of China and India?

Lynn’s
Race Differences in Intelligence lists about 600 IQ studies from around the world.
For China, he found 10 studies, with an average IQ of 106 (on a scale where
Britons
and white Americans are at 100). These studies were all published from
1990 onward (and the young people studied in them were born from about
the 1970s to early 1990s, as shown in the graph above). The scores
appear to be somewhat higher than in earlier years, when the Chinese
were more poorly nourished and educated. In these 10 recent studies,
the
average Chinese IQs range from 101 to 113.
For India, Lynn found 13 studies, from 1966 through 2000. The
subjects measured in them were born from the 1940s through the late
1980s.
The averages range from 78 to 88, with a mean of 83.
There is likely to be some upward movement in test scores in the
future as Indians become better nourished and better educated. Still,
India appears to have a long way to go to catch up to China.
Bennett’s replies, in part:
“The whole question of trying to
make conclusions about ‘national IQs’ from these tests is problematic.
Differential national IQ rates could mean that there are inherent
differences in IQ, but they could just as easily mean that the
socio-cultural-economic differences between nations produce differential
IQ scores for environmental reasons… In a few years further genomic studies
and fMRI imaging of the brain will tell us far more about heredity and
intelligence (and the nature of intelligence) than we can infer today
from the wide and rather problematic assortment of statistical studies
available today. I think speculation about it is a waste of time right
now.”
But (as I responded) it makes no sense to assume that existing IQ
gaps have no real-world impact just because they might prove not to be
genetic. The overwhelming fact is that—whatever the causes of the
disparities may turn out to be—the gaps
exist.
And the crucial point is that China appears to have a lead on India
of at least one standard deviation (by Lynn’s estimate, 1.5 standard
deviations or 23 points). From all we know about national IQ trends over
time, the possibility of that gap disappearing before, say, 2050, is
very small.
Relative differences in average national IQs change even more slowly
than, say, relative differences in average national height, which take a
couple of generations to fully work through the system.
Since IQs are quite
stable
from childhood through adulthood, a trailing population’s main hope for
closing the gap with a higher IQ group rests on its future children.
Let’s look at a stylized example. Assume that the IQ gap between two
populations, such as China and India, is currently 15 points. And,
assume that the babies being born tomorrow in India are suddenly as
smart as the babies being born in China.
The red line reflects the growth in the trailing country’s
workforce’s average IQ if the gap disappeared among all babies born in
2006.
The subsequent narrowing of the workforce disparity wouldn’t even
begin until the 2006 babies started their careers at age 18 in 2024.
If the retirement age is 65 and the population remains stable, then
the gap would only be half-closed by 2047, and wouldn’t disappear until
2071.

We know that a truly bad environment, such as modern Africa’s, can
depress IQ. In Lynn’s new book, he has adopted the argument I made my
2002 VDARE.com review
of his last book that the much lower IQs of black Africans (Lynn now
estimates, based on 57 studies, that the sub-Saharan average is 67)
compared to their African-American cousins (Lynn lists 31 studies since
WWI with a median of 85) is proof that some combination of malnutrition,
poor health, weak education, lack of mental stimulus, or other factors
can drive IQ below its genetic potential.
But it’s unrealistic to assume that the gap will magically disappear among babies in 2006.
For example, there were huge improvements in the environmental conditions of African-Americans in the 20th Century, but the
IQ gap between whites and blacks remained stable at around 15-16 points from WWI onward. Only in the last decade,
Charles Murray reported in
Commentary last year, has evidence appeared suggesting a narrowing of the gap by two or three points.
So, a more plausible guess for our stylized model of how fast a 15
point gap could narrow would be that it might take, say, two generations
(or until 2056, 50 years from now) for the IQ disparity to vanish among
newborns. The blue line in the graph above shows the impact of this
more realistic assumption on the workforce: the intelligence gap isn’t
even halfway gone until 2072, and doesn’t disappear until 2120.
Unfortunately, there’s not much evidence of relative changes in IQ
that large in children over even two generations. Most of the 600
studies of in Lynn’s book are of narrowly defined cohorts of children
(e.g., ages 6-8), so sharp rises or falls in national average IQ should
be visible, if they are occurring.
Thumbing through Lynn’s new book, however, what jumps out at you is
the comparative stability of group average IQs over the decades. The IQ
rich aren’t getting richer, but neither are the IQ poor. Groups seem to
stay about where they started out in the early days of IQ testing.
As I showed a couple of years ago using data from Lynn’s old book, there is some evidence for a
modest upward trend in IQ scores
in Chinese-speaking countries relative to the rest of the world (hardly
surprising considering how much life has improved there). Otherwise,
however, it’s hard to see many relative IQ trends over time.
One possible exception: It looks like the Polynesian Maoris
of New Zealand have, over two or three generations, improved from the
80s into the 90s. But, then again, that might just be caused by the
inevitable noise in the data.
Also, Asian-American scores appear to have increased from the upper
90s into the middle 100s, but that could be due to greater selection for
smarts among immigrants. (Many early East Asian immigrants were
laborers, such as the ones who helped building the transcontinental
railroad, while more recent ones have often been students.)
Or perhaps IQ tests have simply become a little more culturally sensitive and unbiased over the generations.
But, clearly, the overall pattern is relative stability. Here, for instance, is a graph showing that there has been
no overlap of average scores among
Japanese (23 studies, represented in red),
Hispanics in America (17 studies in green), and
Australian Aborigines (17 studies in blue).
(Once again, as in the India-China graph, I’m indicating the estimated average date of birth of the
subjects
of the IQ tests. For example, say there was a study published in 2002
on 9 to 11 year olds. I assume the test was given two years before the
publication date, and the average subject was born 10 years before the
test in 1990.)

The Japanese have consistently scored somewhere around 105 on a scale
where white American are pegged at 100, Hispanics in the U.S. at about
90 (which, by the way, is roughly the world average), and Australian
Aborigines at very low levels.
You’ll note that despite all the hopeful talk about Hispanics
assimilating, the IQ gap has remained at around 10 points going all the
way back to two studies done in the 1920s.
So, whether these big differences in IQ between China and India
originate in purely environmental differences, or from a mix of
environment and genetics, is simply not all that relevant—until you
start thinking about the second half of this century.
Right now, it’s best not to get distracted by this contentious nature vs. nurture issue.
Whatever the cause of the big IQ difference between China and India, it will very likely
still remain for the rest of our lifetimes.
And the existence of that gap is a fact of world-historical importance.
As, of course, is the existence of the gap between Hispanics—and the
post-1965 immigrant influx in general—and white Americans.
It’s already clear U.S. policy, in effect, is to
import poverty because of the
low skill levels of many immigrants.
What Lynn’s data suggests is that we are also importing permanent inequality—and
social strife.
[Steve Sailer [email him] is founder of the Human Biodiversity Institute and movie critic for The American Conservative. His website www.iSteve.blogspot.com features his daily blog.]



 As
Faber notes, then-mayor of San Francisco Gavin Newsom, now a Democratic
gubernatorial contender in California, unveiled a monument to the group
in 2008 and proclaimed: “The spirit of the Abraham Lincoln Brigade is a
legacy we have inherited.”
As
Faber notes, then-mayor of San Francisco Gavin Newsom, now a Democratic
gubernatorial contender in California, unveiled a monument to the group
in 2008 and proclaimed: “The spirit of the Abraham Lincoln Brigade is a
legacy we have inherited.”